.png)
The Workflow Diagram located within the Instance View is based on principles shared with the Workflow Designer. VidiFlow users are able to select individual elements in the workflow, all of which follow the Business Process Model Notation standard. Because VidiFlow' workflows are supported by the Camunda engine, all workflow models are BPMN compliant.
Just as in a modeler, VidiFlow users are able to zoom in and out of the map with the "mouse scroll" and shift the map center to a preferred element. This function is particularly helpful when attempting to view specific portions of the Workflow Diagram in detail.
For more information on BPMN and the Camunda workflow engine, please see 3rd Party Components.
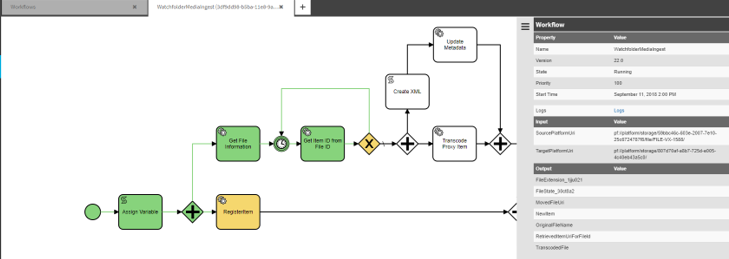
Workflow Diagram: Indicators
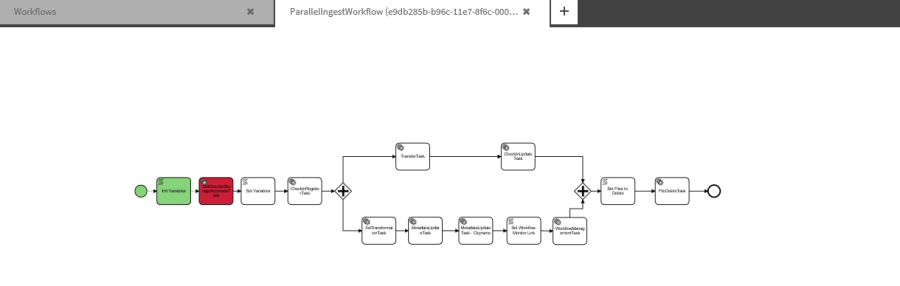
As shown in the example below, the Workflow Diagram can be zoomed to any stage of the workflow. The Diagram also displays elements that have been completed. Color codes indicate the state in which the elements, events or activities have been completed successfully or triggered an incident.
|
|
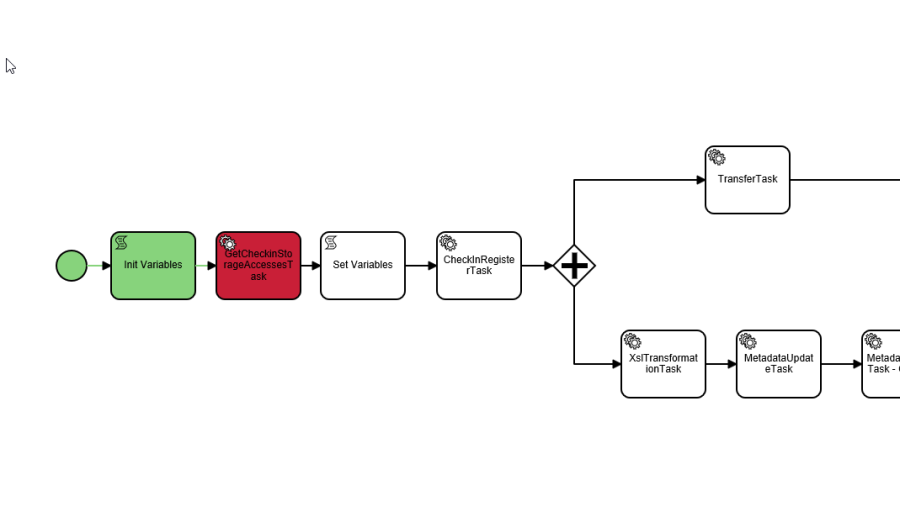
Events and activities that have been completed successfully are filled in with green. |
|
|
Events and activities that have experienced incidents are filled in with red. |
|
|
Events and activities that have yet to trigger are filled in with white. |
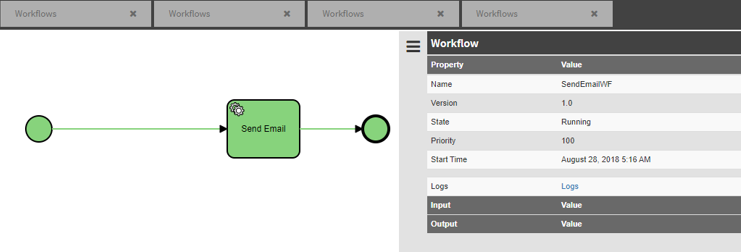
The Monitor is not limited to showing diachronic state of the workflow. If a workflow is running while the Monitor is being used to show the model, it will display the state of the workflow in real time.
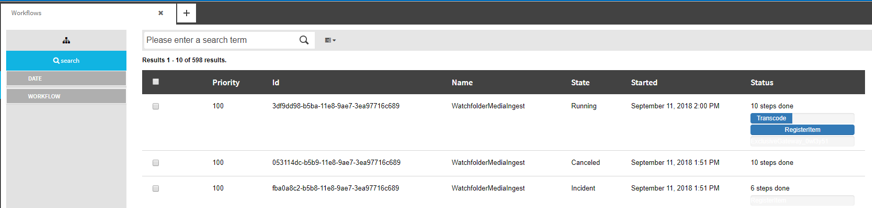
Those elements which have been marked in yellow indicate elements or steps in the workflow which are currently being processed. Users are made aware of the running workflow in the Monitor´s initial window displaying search result list for workflows. Running workflows will express the Running state as well as show an incomplete progress bar.