.png)
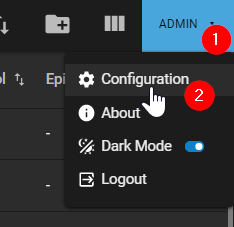
Please note that normal WebUI users are granted a limited view of the Configuration module as depicted in this section. In order to reach the Configuration module, click on the user name and select the "Configuration" option as indicated below.
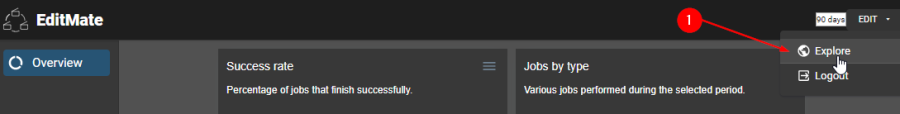
The Overview area, selected by default, serves as a dashboard which provides visibility over actions triggered in EditMate WebUI. From within the Configuration module, users can return to the WebUI by clicking on the "Explore" option (shown below).
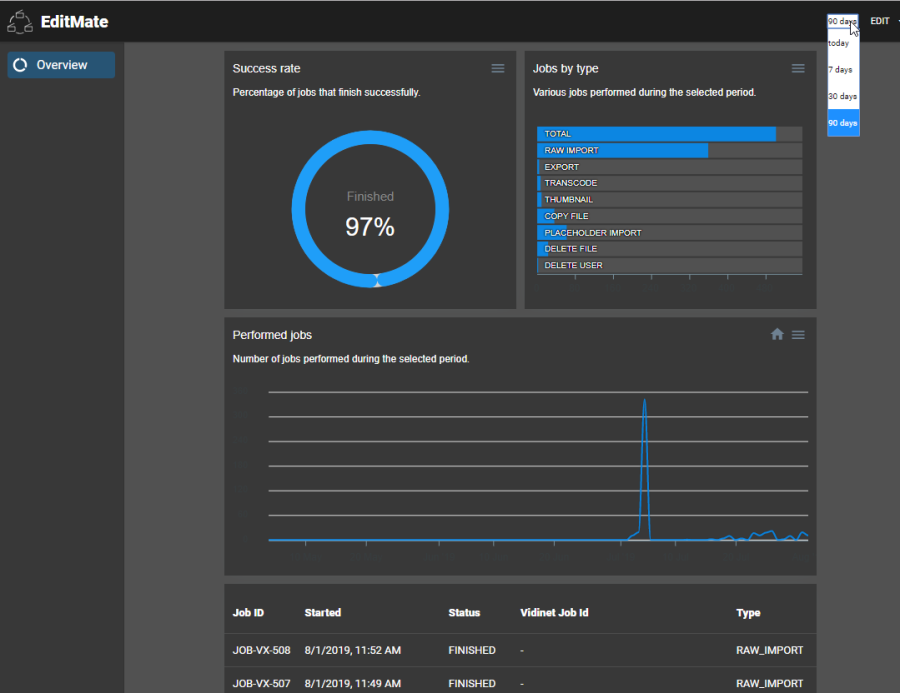
The dashboard, as shown in the example below, is capable of visually representing a range of data over a period of time. Users can select the time range by selecting the desired option on the "Time Range" dropdown next to the user name. The newly selected choice automatically refresh the dashboard to represent the data accordingly.
Regardless of the time range selected, the dashboard's visual representation of data can be divided into four different sections: Success Rate, Jobs by Type, Performed Jobs, Job Entries.
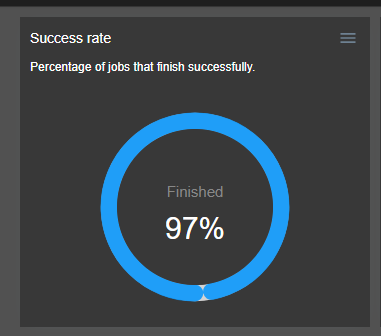
Success Rate
The Success Rate section provides overall rate of success for all the jobs triggered and those which were considered successful.
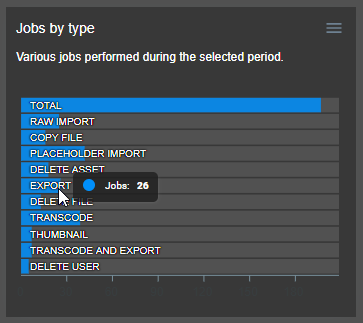
Jobs by Type
The Jobs by Type section divides the jobs by their individual type and counts how many times these were carried out successfully. Hovering over a particular bar will display this count.
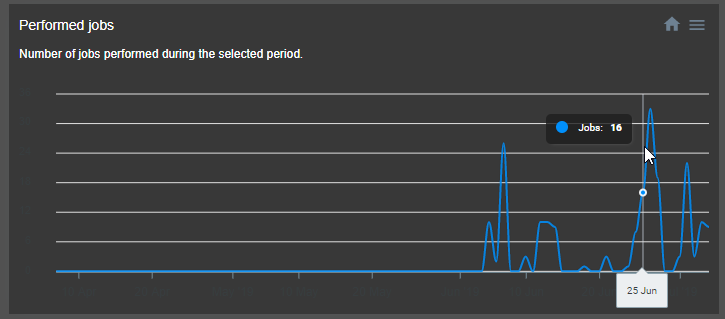
Performed Jobs
The Performed Jobs section focuses on displaying the total amount of jobs carried out successfully over a period of time. It emphasizes the time intervals and the peak in jobs over the course of those intervals. The job count for a specific date can be displayed by simply hovering over the date.
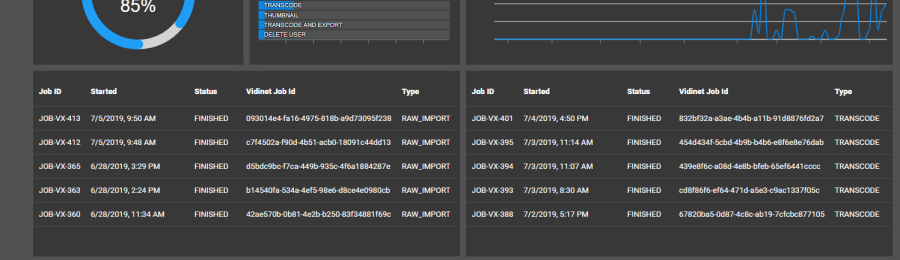
Job Entries
The Job Entries section grants administrators an overview of grouped jobs which have been triggered. These entries are grouped based on their type and sorted by date in descending order.